Happy Monday with Dean and Crystal…
Hey Dean Souza,
It is… another Monday, the first May 2022 report….and it is that day of the week where we look at the behavior of the housing market, leading indicators of market trends, both in the U.S. …and locally…
Shall we get started with some appetizers and some ‘Tidbit’s’?
- Someone call the breakfast police: Tropicana has unveiled a cereal meant to be eaten with OJ instead of milk. Some things just shouldn’t be messed with.
- The typo of a lifetime: a woman won $10M after pressing the wrong button on a lottery-ticket machine when a stranger bumped into her in an LA supermarket. She never got an apology, not that she needs it now.
- RIP, selfie sticks: Snap is launching a mini drone called Pixy that follows you around snapping pics before landing back in your palm.
- SNACK FACT of the DAY: Don’t forget to call Mom… Sunday’s Mother’s Day. For America’s 30M+ working moms, the past two years have been disproportionately hard…So… here’s to ALL the moms on your special day.
Ready… for the main course?
- Let’s look at the US Real Estate Market and how it performed last week:
Home prices hit a new record even as the market slows…
Even though we can see indications that the housing market is trying to get back to more ‘normal ’conditions’, home prices still hit a record high last week, and buyers are still in a heavy, competitive market. There’s still far more demand than there is inventory, however, that does seem to be improving…s.l.o.w.l.y…
Prices:
Home prices hit a new record high last week and ended the week at $425,000. If you’ve been following this weekly report, that should not surprise any of us. It is this writer’s and others’ opinion that we have a few more weeks of rising prices before we hit the historical ‘seasonal price plateau’ sometime in mid-June before backing off later in the year.
New Listings:
The prices of the ‘New Listings’ also hit a new record high last week and also came in at $425,000. When the price of the new listings rises, it’s because the sellers are leading into the demand, and conversely, If the market were weakening, then the price of new listings would be declining.
Price Reductions:
Another leading indicator of the strength of the market is ‘Price Reductions’. In a normal market, 30% of the available listings will take a price adjustment prior to going under contract. For the last two years, price reductions have only totaled approximately 19% of the total inventory, however, this number is starting to climb each week. In 2018, the last time mortgage rates increased, price reductions increased correspondingly to the rise in interest rates, and we expect the same behavior to follow in the coming months as the Fed tries to curb inflation through increases in interest rates.
Immediate Sales:
Last week, there were 99,000 new listings that came on the market. 27,840 or 28% went under contract almost immediately and within hours or days, indicating there is still way more demand than there is inventory. The percentage (28%) of the new listings that went under contract is slightly less than we were experiencing earlier in the year.
Inventory:
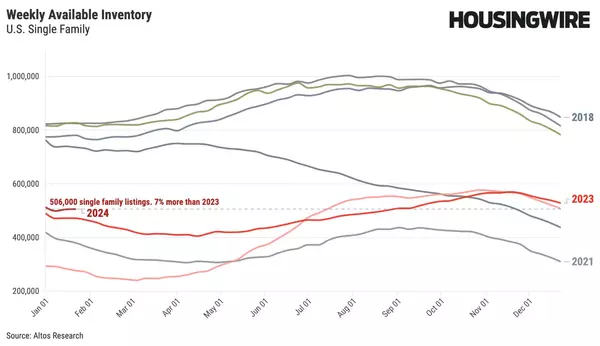
Inventory increased a solid 6% last week to 292,271 available single-family homes listed for sale. It is spring and we had the largest inventory increase all year which was not unexpected and very normal for this time of year. This week, last year, was the low point of inventory for the whole year. In a normal market, we would expect to have 800,000-900,000 homes for sale, and based on our projections, we expect the end the year with just under 400,000 homes in inventory, which would still only be one-half of a normal inventory.
In summary…
Even with inventory and interest rates rising, we project to continue to have a higher demand than the supply of homes can satisfy.
The decision to purchase a home is more based on life events as opposed to interest rates. What interest rates do affect is that maybe we purchase Home B as opposed to Home A, because the financial scenario is less palatable to purchase Home A when interest rates are at 5+%.
What interest rates also do is make it less affordable to keep the primary home as a rental while purchasing the new family home, therefore, bringing more inventory back into the market.
With that being said, there still is no imminent cataclysmic event that will bring hundreds of thousands of homes into the market any time soon, and the return to normalcy is more of a long-term event as opposed to a quick return.

Okay, friends… it’s time to get local…and here is what happened in our Local Markets last week:
Castro Valley: This week the median list price for Castro Valley, CA is $1,643,000 with the market action index hovering around 85. This is an increase over last month’s market action index of 84 and a slight decrease from last week’s MLP. Inventory has increased to 28, an increase of four. Median days on market are down this week to 7 as are the average days on market coming in at 14. The market has not shown strong directional trends in terms of supply and demand. However, inventory is sufficiently low to keep us in the Seller’s Market zone and prices have been moving upward as evidence.
San Lorenzo: This week the median list price for San Lorenzo, CA is $771,950 with the market action index hovering around 95. This is an increase over last month’s market action index of 93. Inventory has increased to 12. Median days on market is at zero while average days on market is at 8. While the Market Action Index shows some strengthening in the last few weeks, prices have not seemed to move from their plateau. Should the upward trend in sales relative to inventory continue, expect prices to resume an upward climb in tandem with the MAI.
San Leandro: This week the median list price for San Leandro, CA is $949,943 with the market action index hovering around 85. This is less than last month’s market action index of 87. Inventory has increased to 36. Median days on market is at 7 this week and the average days on market is at 14. The market has been cooling over time and prices plateaued for a while. Despite the consistent decrease in MAI, we’re in the Seller’s zone. Watch for changes in MAI. If the MAI resumes its climb, prices will likely follow suit. If the MAI drops consistently or falls into the Buyer’s zone, watch for downward pressure on prices.
Hayward: This week the median list price for Hayward, CA is $989,444 with the market action index hovering around 94. This is about the same as last month’s market action index of 84. Inventory has increased to 66. The median days on market is at 7 while the average days on market is at 27 this week. In the last few weeks, the market has achieved a relative stasis point in terms of sales to inventory. However, inventory is sufficiently low to keep us in the Seller’s Market zone so watch changes in the MAI. If the market heats up, prices are likely to resume an upward climb.
Union City: This week the median list price for Union City, CA is $1,424,500 with the market action index hovering around 83. This is less than last month’s market action index of 84. Inventory has increased to 16. Median days on market is at 11 while the average days on market is at 16. While the Market Action Index shows some strengthening in the last few weeks, prices have not seemed to move from their plateau. Should the upward trend in sales relative to inventory continue, expect prices to resume an upward climb in tandem with the MAI.
Danville: This week the median list price for Danville, CA is $2,812,500 with the market action index hovering around 90. This is an increase over last month’s market action index of 88. Inventory has increased to 50. Median days on market is at 7 while average days on market is at 49. Home sales continue to outstrip supply and the Market Action Index has been moving higher for several weeks. This is a Seller’s market so watch for upward pricing pressure in the near future if the trend continues.
In closing…
As your Real Estate Market Experts, Crystal and I work hard to study the market and bring a deep understanding of the market’s complexities, a lengthy list of qualified buyers, and access to off-market opportunities, to you…and… at the time when you need that expertise, experience and the knowledge gained from closing over 4,000 transactions.
Almost any realtor can sell your home, and there’s a difference between selling your home and closing it, and knowing that it was done expertly and 100% all about you and what you and your family.
Crystal and I commit 100% of our energy and focus to that goal…for you.
Warmly , Dean Souza
Dean & Crystal Souza
Realtor | Broker Associate
Century 21 RE Alliance – Souza Team
homes@souzateam.com
510-881-1761
DRE 00967442 | 01448392
Focused on the Success of Your Move
This is not intended to solicit properties or persons under contract.
GET MORE INFORMATION


